Azure SQL Data Warehouse as a backing store for your SSAS cubes

For Sql Server Analysis Services, migrate sourcing data from Sql Server to Azure Sql Data Warehouse.

Introduction

OLAP cubes in Multidimensional model provided by the SQL Server Analysis Service (SSAS) generally connect to a SQL Server database as a Data Source. However, as your data grows, query latency takes a hit, slowing down the build, deployment and operation of the cubes in SSAS. In order to improve the performance of queries to the sourcing database, you can migrate your data from a SQL Server to Azure SQL Data Warehouse, which is a cloud based,  linearly scalable database built on Massively Parallel Processing (MPP) architecture.

This article provides you detailed information on how to perform this migration. It starts with uploading the AdventureWorks2012 tutorial database to a SQL Server and a cube created from the Multidimensional Modeling Tutorial. You do not need to go through that detailed tutorial to create the cubes. Instead this article provides links to simply restore the SQL and SSAS Databases from backups.

Setup

Prerequisite

  1. A SQL Server with SSAS 2016 running in a Windows VM
  2. (SSMT) SQL Server 2016 Management Studio (used v 13.0 in the example here)
  3. Visual Studio with SQL Server Data Tool (used Enterprise 2015 version 14.0)
  4. Azure Subscription to create an Azure SQL Data Warehouse instance and Azure Data Factory
  5. MS Excel

Create the SSAS cubes sourced from a SQL Server.

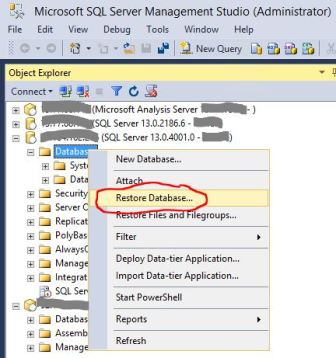
Start SQL Server Management Studio, i.e. SSMT, and connect to the SQL Server 2016 Database Engine

  1. Right click on Databases on the left panel
  2. Select Restore Database and follow steps to restore from the AdventureWorksDW2012.bak file
restoredatabase
Fig 1. Restore Database in SQL Server

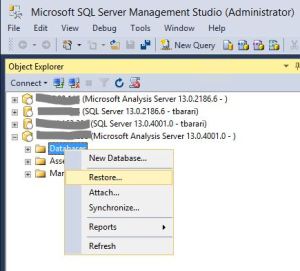
Connect to the SQL Server Analysis Server

  1. Right click on Databases on the left panel
  2. Select Restore and follow steps to restore from the Analysis Services Tutorial.abf file
restoressas
Fig 2. Restore Analysis Service database

Unzip Analysis Services Tutorial.zip, in a folder in your local file system and open Analysis Services Tutorial.sln from Visual Studio to build and redeploy the Multidimensional model to test the development environment.

  1. In Visual Studio, open Solution Explorer and expand the Solution.
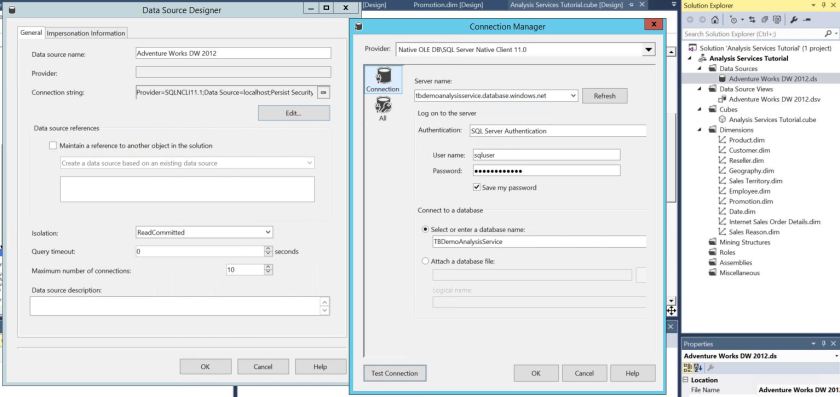
  2. Double click on Adventure Works DW 2012.ds under Data Sources
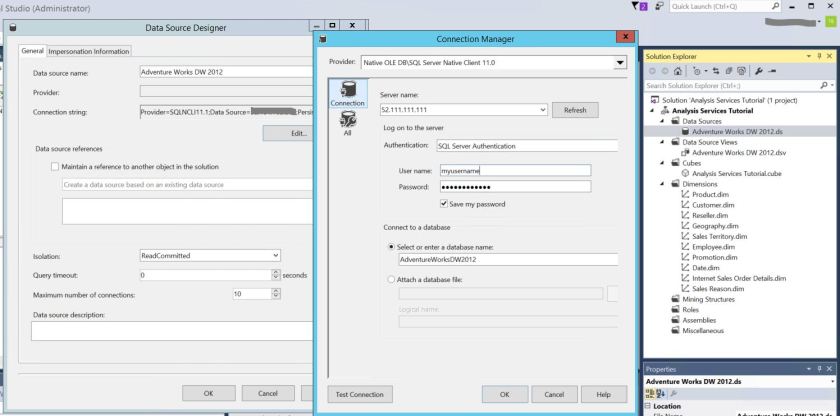
  3. In Data Source Designer dialog box, click on the Edit button
  4. In Connection Manager pop-up, change the Server name field to the server address of your SQL Server Database, change the user name and password
  5. Click on Test Connection to check connectivity to your Database.
  6. Hit OK to return back
visualstudiocube
Fig 3. Configure Model in Visual Studio to your SQL Server
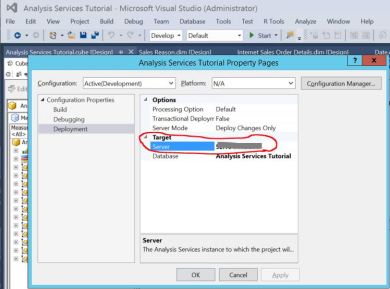
  1. Click Project -> Analysis Service Tutorial Properties and in pop-up window, click on Deployment in left panel
  2. Under Target sub section, edit Server and enter IP address of your SSAS Server
  3. Build and Deploy the model to the new Analysis Server to test
visualstudioproject
Fig 4. Configure Deployment Target to your SSAS in Visual Studio

View the Cube in Excel

Once the build and deployment is complete, you can view the Cube in Excel.

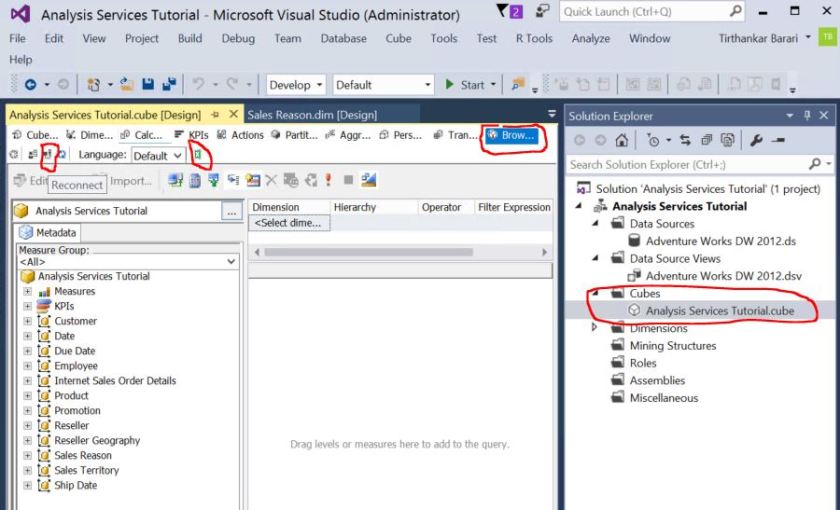
  1. In Visual Studio, in Solution Explorer under Cubes, double click on the Cube, Analysis Services Tutorial.cube
  2. On the canvas to the left of Solution Explorer, click on Browser from the tabs.
  3. Click on the Reconnect icon underneath.
  4. Once reconnection completes, click on the Excel icon next to it.
openinexcel
Fig 5. Open Cube in Excel

When Excel opens

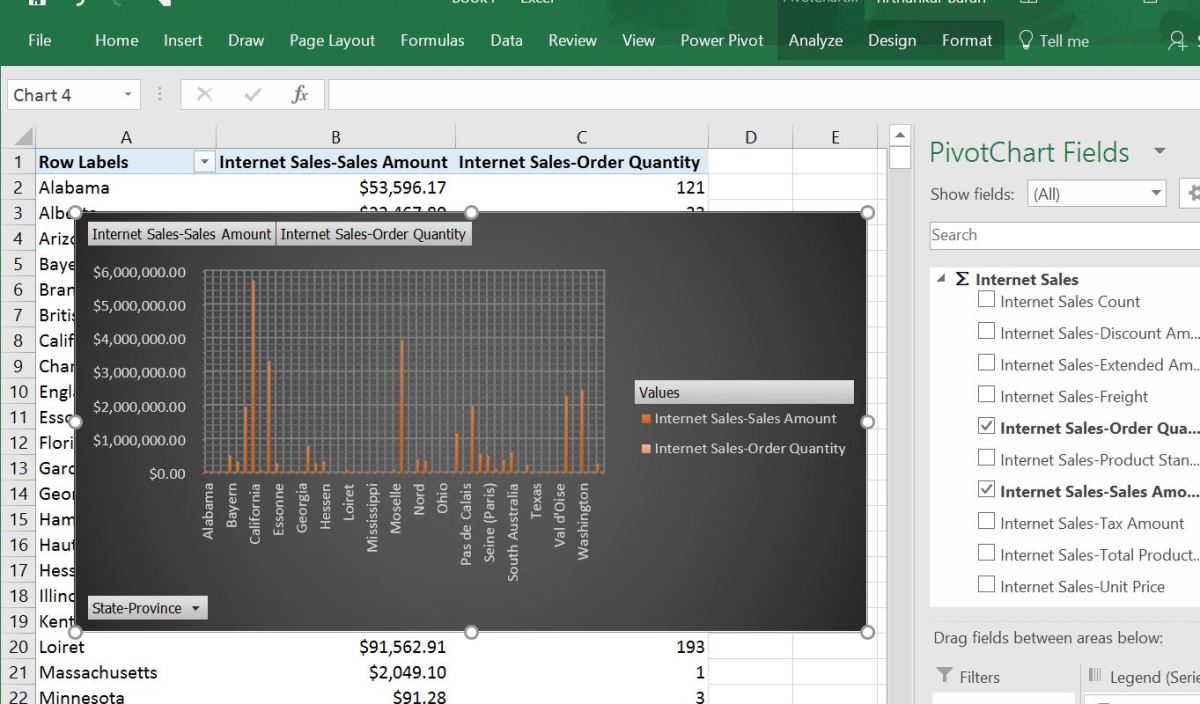
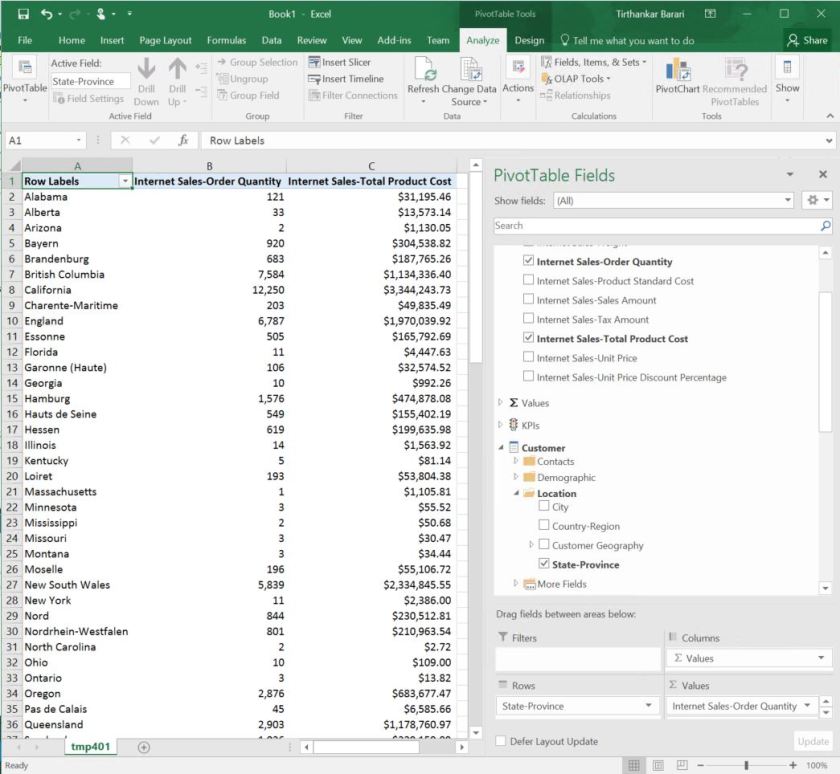
  1. Chose the Internet Sales perspective and hit OK
  2. In PivotTable Fields, under Internet Sales, check Internet Sales-Order Quantity and Internet Sales-Total Product Cost
  3. In PivotTable Fields, under Customer, Location check State-Province
  4. Now you will see the values on the left side as shown in the figure below.
Excel-SalesBySate.JPG
Fig 6. Excel view of data from SSAS (data sourced from Sql Server 2016)

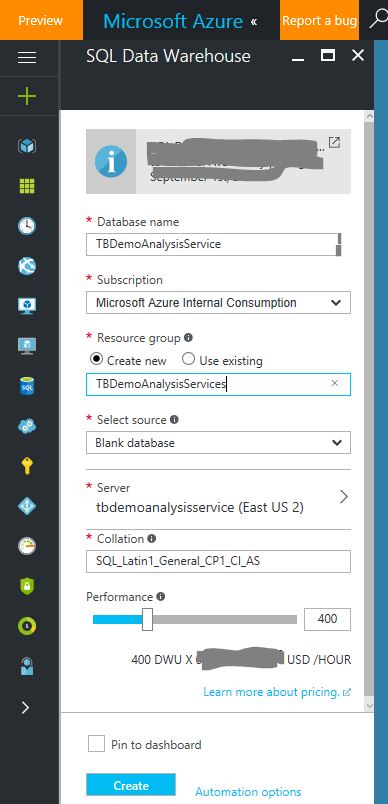
Create Azure SQL Data Warehouse instance

Use Azure Portal to create the Azure SQL Data Warehouse instance, named TBDemoAnalysisService. In this example, the server name is tbdemoanalysisservice.database.windows.net and the name of the Azure SQL Data Warehouse is TBDemoAnalysisService. Also, remember the username and password you entered when creating the server. You will need these when reconfiguring SSAS to point to this Data Source.

azureportalsqldw
Fig 7. Create Azure SQL Data Warehouse

Migration from SQL Server to Azure SQL Data Warehouse

Create Schema in Azure SQL Data Warehouse using Data Warehouse Migration Utility

Use Data Warehouse Migration Utility to generate database schema from the above SQL Server 2016, AdventureWorksDW2012 instance for the Azure Sql Data Warehouse, TBDemoAnalysisService.

dwmigrationutility
Fig 8. Migrate the Database Schema

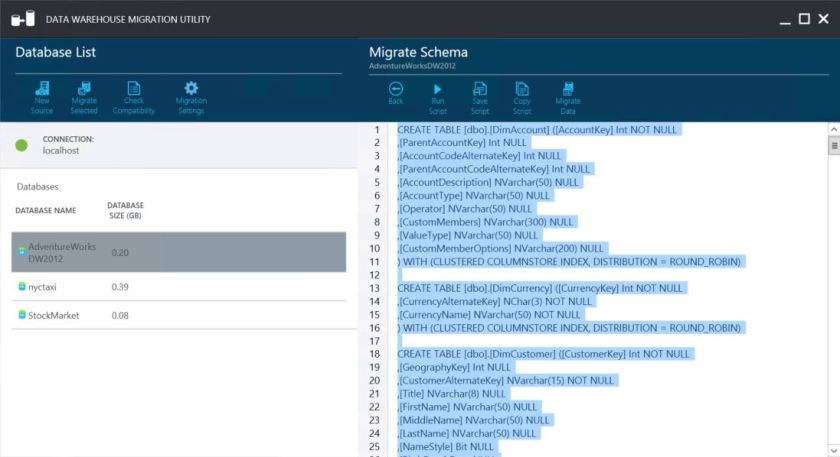
Save the migration schema generated by the Utility as shown in Fig 8. in a .sql file and execute it against the Azure SQL Data Warehouse instance, TBDemoAnalysisService, using SSMT.

Note: Data Warehouse Migration Utility will ONLY migrate the tables and NOT any View, User Defined Function etc. You have to manually migrate those.

Alternative Approach to migrating the database schema

Alternatively, you can use the script from here to create the tables, views and user defined functions in TBDemoAnalysisService in Azure Sql Data Warehouse, using SSMT.

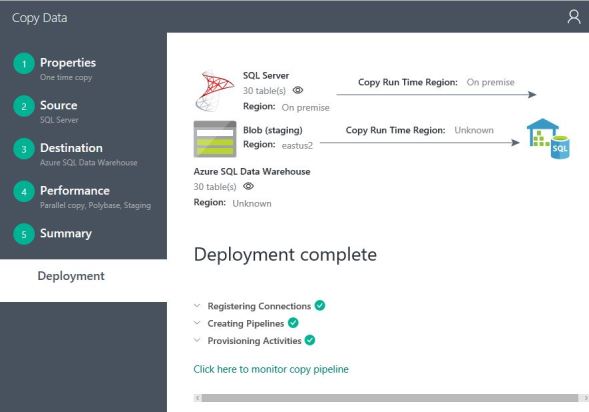
Copy the Data from SQL Server 2016 to Azure SQL Data Warehouse using Azure Data Factory

Use Copy data tool in Azure Data Factory to copy the data from AdventureWorksDW2012 running in your SQL Server, to Azure Sql Data Warehouse running TBDemoAnalysisService instance. Make sure, you do NOT copy the views over.

ADF.JPG
Fig 9. Copy data in Azure Data Factory

Note: There are other ways to migrate the data, using Data Disks, manually created Polybase scripts etc. If your data is more than several Terabytes or network connectivity is a concern, then you may have to explore those alternatives. However, majority of the cases, Azure Data Factory is the best option.

Change Analysis Service Data Source from Sql Server to Azure Sql Data Warehouse

  1. In Visual Studio Window, where you had opened the Analysis Service project, double click on the Data Source, Adventure Works DW 2012.ds, in Solution Explorer panel on the right side.
  2. Hit Edit in the Connection string field
  3. In Connection Manager pop-up, change the Server name field to the Azure SQL Data Warehouse server address of the instance you created above, change the user name and password and the database name to TBDemoAnalysisService
  4. Click on Test Connection to check connectivity to your Database.
  5. Hit OK to return back
  6. Build and Deploy the model to the above existing Analysis Server
azuresqldwconnection
Fig 10. Configure Model in Visual Studio to Azure Sql Data Warehouse

View the Cube in Excel

Once the build and deployment is complete, go back to the Excel Viewing Section above and open the Excel Spreadsheet and verify that you see the same data. The difference this time is that, the sourcing database is from Azure SQL Data Warehouse INSTEAD of Sql Server 2016.

excel-salesbysate
Fig 11. Excel view of data from SSAS (data source in Azure SQL Data Warehouse)

Send, receive and visualize real-time data with Azure

Send, receive and visualize millions of events per second using java client code, Azure Event Hub, Azure Stream Analytics and Power BI.

Introduction

Using Azure Event Hub, Azure Stream Analytics, Power BI and a little bit of coding you can build a highly scalable, distributed and fully managed real-time event processing system.  This article describes how you can build such a system in less than an hour!

Azure Event Hub is a scalable event processing service that can ingest millions of events per second. You can setup multiple parallel executors to subscribe to this service to receive these events for further processing. You can also connect this service to Azure Stream Analytics jobs to transform/process incoming events using an SQL like language and route the results to a destination data store or to a data visualization tool like Power BI all in real-time.

The concept of Partition in Azure Event Hub enables you to parallelize downstream consumption of events by your receivers. Incoming event to your event hub is spread across these partitions (typically, between 2 to 32, configured by you in Azure). You can also send events to specific partitions if you have to. Though it is better to use Publisher Policy in such a case. The diagram below captures the essence of Event Publishers, Partitions and Readers in an Event Hub. Further details are at the official documentation site.

eventhub
Fig 1. Azure Event Hub

Java Code for Event Publisher/Consumer

In my example here, I am generating a dataset {id, partitionId, createTime, count, value} from the Event Publishers (aka Sender). In this example, for each partition in Azure Event Hub there are N number of Event Publishers sending events to a specific partition. However, you do not have to send events to specific Partitions as stated above. Each Event Publisher is incrementing its count field by 1 starting with 0, and generating a random number between -1000 and +1000, for every sent event. By default, events are sent every 60 seconds. These parameters are all configurable in the eventhub.properties file in the codebase.

The Event Consumer (aka receiver) code starts an asynchronous listener for each partition. So, there is an Event Consumer collecting all events sent by the N Event Publisher for each Partition. If your Event Hub is configured to with 2 Partitions and eventhub.sender.count in eventhub.properties file in your code is 4, you are running 8 Event Publishers and 4 Event Consumers. The code uses the default consumer group for keep things simple.

The code is written in Java and available in GitHub.

Setup

You need an Azure Subscription and a Power BI account for this exercise.

Azure Event Hub Setup

createeventhub
Fig 2. Create Event Hubs

From Azure Portal, create the Event Hub Service  (New->Internet Of Things -> Event Hubs). Fig 2. shows the different fields in the page. The Name here should match the eventhub.namespace property in the eventhub.properties file above in your code. In pricing tier, you can select between Basic and Standard. The latter gives you more Consumer Groups, Brokered connections, Message retention, Publisher policies.

Generally, it is best practice to create a new Resource Group for the new Event Hub Service. It is easier managed that way.

Once the Service is created and you are inside the Event Hubs blade, look for the + Event Hub link at the top of the middle blade. Click the link to create a new Event Hub. Note that Name should match eventhub.name property in the eventhub.properties file above in your code. The partition names by default are 0, 1, 2 and so on. So, if you have 2 partitions, the corresponding entry for eventhub.partition.ids in the eventhub.properties file above in your code is 0,1.

createeventhub
Fig 3. Create an Event Hub

Click the Shared access policies link in left blade in Fig 3. and click on the default policy RootManageSharedAccessKey and note Secondary Key, which should match eventhub.sas.key in the eventhub.properties file above in your code.

Azure Stream Analytics

createeventhub
Fig 4. Stream Analytics Topology

From the Azure Portal, create a Stream Analytics job by clicking New -> Internet of Things -> Stream Analytics job. Fill in the form with necessary information. Once the job is created, notice under the left blade, links to Inputs, Query and Outputs, as in Fig 4. Use these links to define your input source, the query on the in coming data and the destination.

In our example, the input is coming from the Azure Event Hub we created above. The query is a simple pass through that selects all data from input. The output will be sent to Power BI.

createeventhub
Fig 5. Stream Analytics Input from Event Hub

As you see in Fig 5. if you select ‘Use event hub from current subscription’ from Subscriptions in the first field, the remaining fields are filled from your subscription by Azure Portal.

Make sure the Event serialization format is set to JSON. The java code in the example here, sends events in json format. You can customize it to csv or Avro if you want.

Provide an input alias for this input source. In Fig 5. it is entered as TBDemoStreamAnalyticsInput.

createeventhub
Fig 6. Stream Analytics Output to Power BI

Next, from Outputs link in your Stream Analytics left blade, select Power BI, enter an Output Alias and Authorize to Power BI with your Power BI account. For our example here, we are assuming the Output alias as TBDemoStreamAnalyticsOutputPowerBI.

Once you authorize to Power BI, you can then select a Dataset Name for this output in Power BI for one of your Group Workspaces.

In our example, we user TBDemoStreamAnalyticsDataset as the Dataset name and select the default My Workspace.

You should also select a Table name for Power BI to persist the data. In our example, it is TBDemoEventsTable.

Now click on Query in your Stream Analytics left blade and enter SELECT * INTO TBDemoStreamAnalyticsOutputPowerBI FROM TBDemoStreamAnalyticsInput.

Operation

Send and Receive Events using java code

Get the code from GitHub into a local folder in your desktop running Java 8 and Maven. Read the README.txt file. Edit the src/main/resource/eventhub.properties file and ensure the properties match the Event Hub setup from the above Setup section. Run the following from your local folder, from command line, to start the Event Senders.

mvn install
mvn package
java -jar .\target\TBCodeEvents-0.0.1-SNAPSHOT-jar-with-dependencies.jar META-INF/eventhub.properties send

On a different terminal window, go to the root source folder as above, and run the following command to start the Event Receivers.

java -jar .\target\TBCodeEvents-0.0.1-SNAPSHOT-jar-with-dependencies.jar META-INF/eventhub.properties receive

You should start seeing messages being sent and received in the two terminals as below.

createeventhub
Fig 7. Java code sending Events to Event Hub
CreateEventHub.JPG
Fig 8. Java code sending Receiving Events from Event Hub

View Events from Power BI

Log in to your Power BI account and under Datasets on the left Menu list, click on Streaming datasets. You should now see the incoming Streaming data in the list. In our example, it is TBDemoStreamAnalyticsDataset.

createeventhub
Fig 9. Power BI Streaming Dataset

Click on the first icon under Actions, which is to create report.

In the Power BI Reports Dashboard, select a line graph and plot the value field against any of the time fields.

Below in Fig 10. you see a plot of all events from all the different Event Senders, sent every minute. You can easily validate from the graph that the Senders are all sending in random values. Also, the random values are between -1000 and +1000, as set in your java code.

randomnumberspowerbi
Fig 10. Data from Event Hub received by Azure Stream Analytics captured and visualized in Power BI

My introduction to blogging

My first blog.

Hello world

This is my first blog post. In the past, my work and role in technology was to deliver mostly proprietary material. There was definitely a lot of material that could have been shared universally, that came out of those initiatives. However, there was not much motivation to make time for it, lest I lose focus! The fault is entirely mine. In retrospect, I do regret missing so many opportunities to share little things that could have been mutually beneficial.

I want to begin my journey by acknowledging the contribution of countless bloggers on a plethora of technical topics, that helped me incredibly in my career. Without their selfless contributions and flow of valuable information, I would not be where I am today. My achievements, however insignificant, is not what I am referring to, but I am alluding to the satisfaction in reaching a milestone at work. And the role of blogs, wiki posts, stackoverflow, quora, MOOCs, and countless other sources of information in the internet has been astounding.

In this post, I am learning about the features I get from WordPress and try to exercise some of these here.

So, bear with me for some time. And I will be more diligent in posting technical materials as and when I have something worthwhile.

Best wishes and thanks for all the endeavors to make the world a better place each day.

– Tirthankar

My personal philosophy – Listen, learn and be positively creative to achieve together

2012-07-21 20.04.06.jpg